Polar plots
A polar axes draws (theta, r) on a circular frame. Ask for one with
projection="polar", on subplots or on a single add_subplot cell:
fig, ax = pp.subplots(projection="polar")
fig, ax = pp.subplots(1, 2, projection="polar")   # every panel polar
ax = fig.add_subplot(gs[1, 1], projection="polar") # one polar panel in a grid
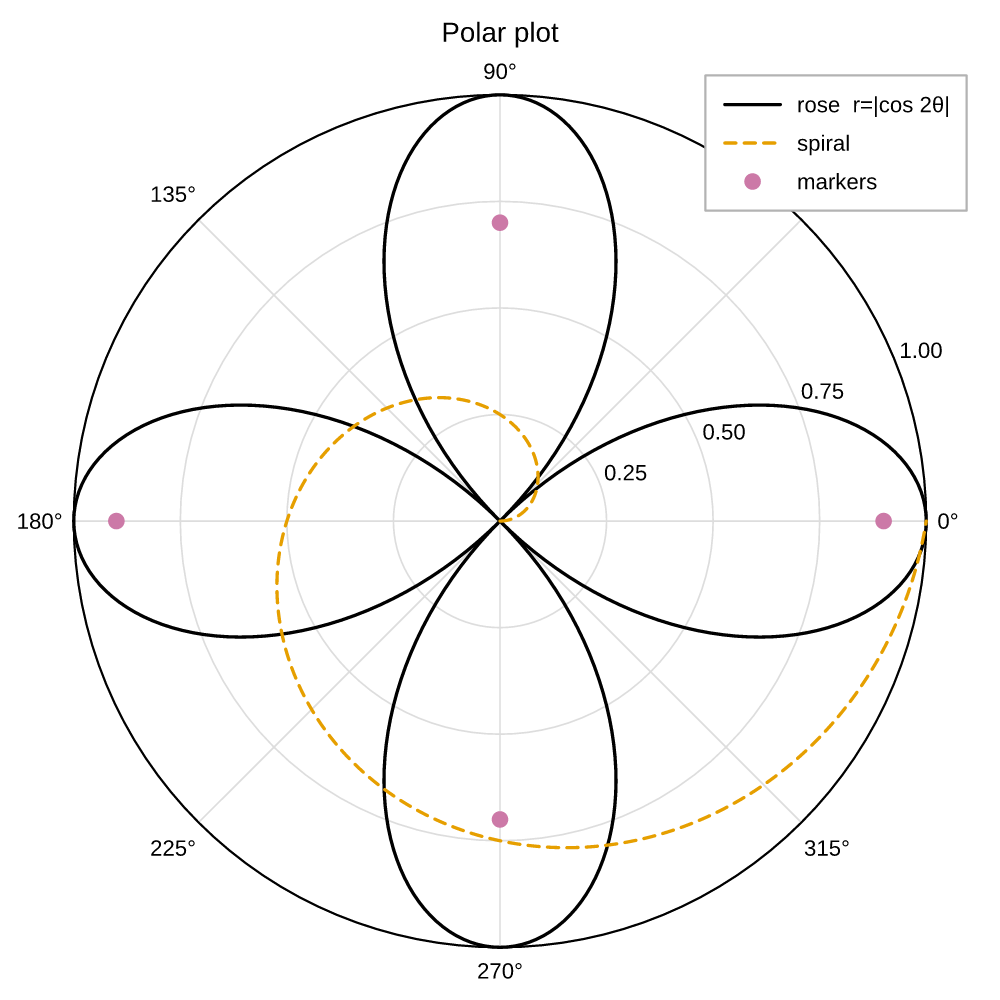
"""Polar plot: line + scatter on a polar projection, with a legend."""
import math

import pyplotrs as pp

theta = [i * math.pi / 180 for i in range(0, 361)]
fig, ax = pp.subplots(projection="polar", figsize=(360, 360))
ax.plot(theta, [abs(math.cos(2 * t)) for t in theta], label="rose  r=|cos 2θ|")
ax.plot(theta, [t / (2 * math.pi) for t in theta], label="spiral", linestyle="dashed")
ax.scatter([0, math.pi / 2, math.pi, 3 * math.pi / 2], [0.9, 0.7, 0.9, 0.7],
           color="C7", label="markers")
ax.set(title="Polar plot")
ax.legend(loc="upper right")
fig.save("polar.png")
Marks
A PolarAxes carries two marks —
plot and
scatter — with the same styling arguments
as their Cartesian counterparts (color, linewidth, linestyle, marker,
markersize, alpha, label, zorder):
ax.plot(theta, r, label="response", linestyle="dashed")
ax.scatter(theta, r, color="C3", markersize=4, label="peaks")
ax.legend(loc="upper right")
Angles are in radians, counter-clockwise from the positive x-axis (East) — matplotlib's convention. Convert on the way in if your data is in degrees:
The dial
set configures the frame:
ax.set(
    title="Antenna pattern",
    rmin=0, rmax=1,                 # radial limits
    rticks=[0.25, 0.5, 0.75, 1.0],  # radial gridline positions
    thetagrids=[0, 45, 90, 135, 180, 225, 270, 315],  # spokes, in degrees
    theta_zero_location="N",        # what sits at theta = 0
    theta_direction=-1,             # clockwise
    rlabel_position=22.5,           # angle the radial labels sit along
)
Note the asymmetry, which follows matplotlib: thetagrids and
rlabel_position are in degrees (they are chrome positions you read off a
protractor), while the data is in radians.
theta_zero_location takes "E" (default), "N", "W", "S", or an angle in
radians. theta_direction is 1 for counter-clockwise (default) or -1 /
"clockwise" / "cw".
A compass-style dial — north at the top, clockwise, degrees on the rim — is therefore:
Reading it back
ax.get_rlim()             # effective (rmin, rmax) — the data range if not pinned
ax.get_rticks()           # located radial ticks
ax.get_thetagrids()       # spoke angles, degrees
ax.get_theta_direction()  # 1 or -1
What a polar axes does not have
It is a circular frame, not a Cartesian one, so there is no xlabel/ylabel,
no xlim, and no Cartesian mark vocabulary (bar, imshow, …) on it. Legends,
themes, $...$ math in the title and labels, and every output format work
exactly as they do elsewhere — including figure-level legends, which collect
polar panels along with the rest.